Visual & Data Journalism at BBC
ggplot2
visualizations
The BBC News data science and visualization team published this great overview on their analytics and visualizations lessons learned over the course of 1.5 years.
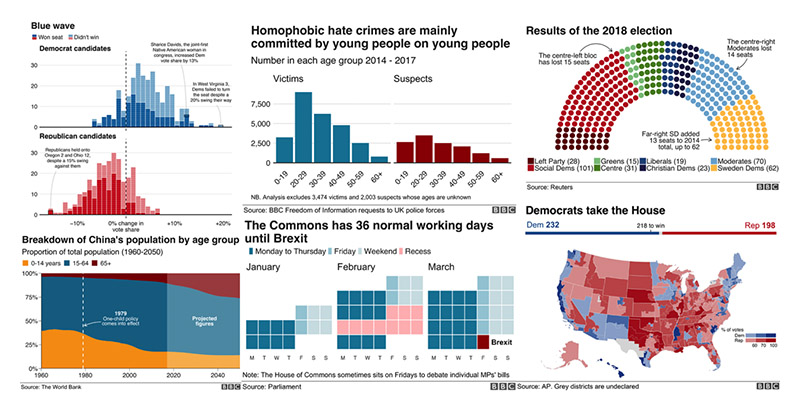
Great read, AND super neat to see the BBC team open-source their BBPLOT and R Cookbook to help streamline your visualization workflows, reduce manual repetition of code setup for a ggplot2 viz, and to educate you on better storytelling approaches with R.
Links:
- “How the BBC Visual and Data Journalism team works with graphics in R” by BBC Visual and Data Journalism
- BBC’s bbplot package on GitHub
- BBC’s R Cookbook